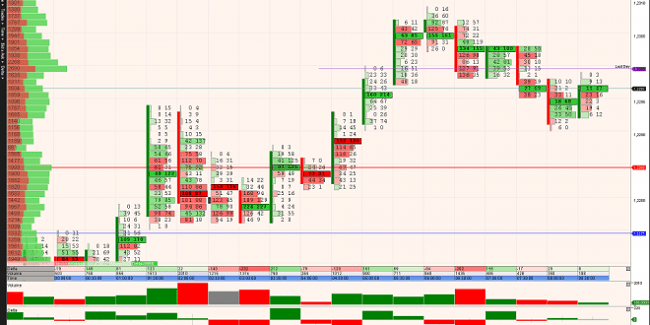
I want to tell you about a useful tool for analyzing the market situation in this article called footprint. We have already talked earlier about how important it is to take into account the volume of open trade transactions on a particular trading instrument. Footprint makes this task easier. It allows the trader to use maximum information in the analysis, and this will eventually lead to improved trading results. Footprint is a chart displaying the price of the volumes of transactions of both sellers and buyers. And it’s done for every candle. There are two ways to take advantage of this information. You can set the corresponding indicator in MT4. But it’s paid. And you can use the corresponding free service. Like the ATAS platform. That’s what I’m suggesting you consider.
ATAS platform
For the beginning it is necessary to go to the corresponding site and to pass registration for opening a demo account. It’s done in a standard way, and there shouldn’t be any problems. Next, select the necessary trading instrument and open its chart. The platform offers different options for displaying it. But you have to choose Clusters. After its activation, the chart will show the necessary data on transactions, i.e. football print.This is how it will look:

Reads this information as follows.The stripes to the left of the red color indicate the degree of activity
“bears,” and the green stripes are “bulls.” If, at this point in time, the buyers
more, the corresponding cell is colored green on the chart. А
if the salesmen prevail, in red. And that’s not all. Pay attention to
Cells that are not just highlighted in color, but are bold and darker
color. These are periods of very high activity.If you want, you can work with the settings of such a chart. For example, you can make the chart show only the difference between the volumes of deals of buyers and sellers.
How to use a footprint in trading
Before everything, you should understand that this tool allows you to evaluate the existing imbalance between “bulls” and “bears”. Keep in mind that the price always tries to eliminate it.Lines formed by cells with high activity can
to be considered as support and resistance levels. And yet they can…
do not coincide with the levels that we used to build on the chart as usual
in the way that Footprint helps to determine if a level sample is false. To do this, you need to see how high the activity of buyers and sellers at the time of breakdown is. Suppose the price broke through the resistance level at high activity of buyers. But on the next candlestick we see that the volumes of sellers’ deals exceed the volumes of buyers’ deals. Which means the breakdown could be false. We have to wait for the next candle and see how the volumes of trades of “bulls” and “bears” will change, and who will win in this fight.Footprint can give a trader a lot of useful information. But first you have to learn how to work with it on a demo account.Fyodorov’s Inga12.08.2019
