Today I would like to offer you the Vortex indicator. Its algorithm is based on a directional motion index. This instrument performs calculations based on which it determines the prevailing direction of price movement in the market. It uses maximums and minimums of candlesticks for calculations. The difference between the candlestick’s maximum and the previous candlestick’s minimum is considered a positive trend. The difference between the minimum of the candlestick and the maximum of the previous candlestick is a negative trend. Then Vortex sums up the obtained values for a certain period of time. The result is corrected. And this is done with ATR (period 1). Based on the results of all calculations, the Vortex indicator forms the most accurate assessment of the market situation. It can be used to make a trading decision.
When to open trades
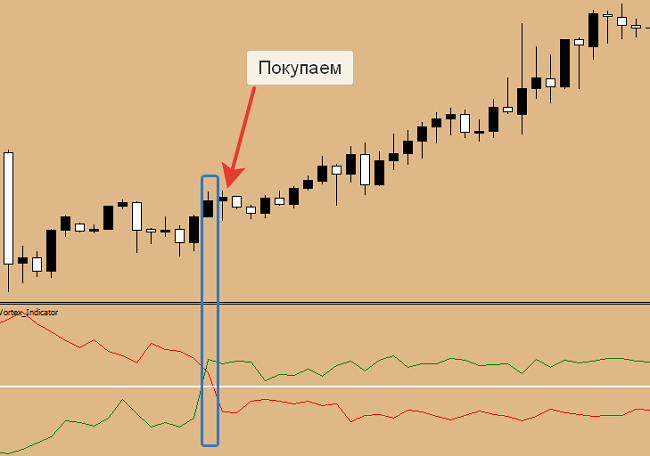
All beginner traders will understand the conditions of market entry by this indicator. They’re so simple. Vortex indicator is displayed on the chart as two lines (red and green). They overlap periodically, and at such moments decisions are made to open trading positions. The red line indicates the strength of the downward trend in the market, the green line indicates the strength of the upward trend. Based on this, conclusions are made about the priority direction for opening trade orders.If the green line is close
the white level crosses the red line from bottom to top, it’s
is a testament to the power of the bulls. Buying. If the red line is near
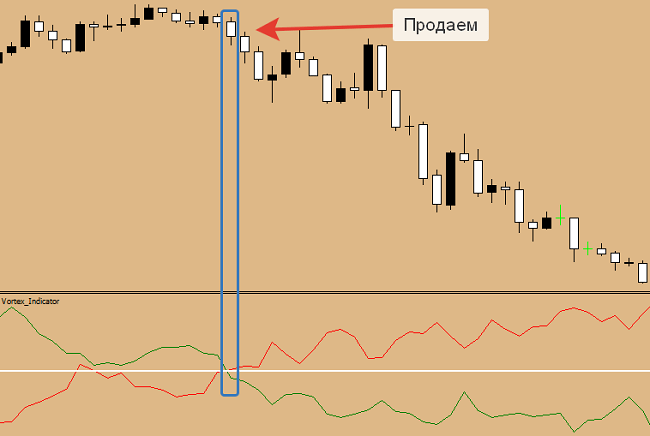
the white level crosses the green line from bottom to top, it’s
testifies to the power of bears. Sell. And now let’s see how the above
looks on the chart. Purchase example:

We enter the market at the opening
the next candlestick after the one where the lines crossed.Sale example:

I want to draw your attention
for another important moment. When the existing trend line (red or
green) is farther away from the level by a considerable distance, it may
be considered a signal of its imminent completion and turnaround
the direction of price movement. Recommended time for closing trade orders.What about the parameters of this
of the indicator, it’s just one – VI_Length. This is the period that will be
used for calculations. And by the way, Vortex indicator can be successfully used not only in Forex, but also in binary options trading. Prior to moving to a live account, it is necessary to perform preliminary testing of the indicator on a demo account.VortexDownloadFyodorov’s Inga25.04.2019
