The Solar indicator has been online for quite some time now. However, its first version had a lot of complaints from traders. The redrawing was the main and serious drawback of the indicator. However, then the creator of this technical analysis tool made changes to the algorithm of its work, which allowed to exclude redrawing. However, it is only absent in the real market. Its data are still displayed incorrectly on the history.
Installation and configuration
The MT4 Solar trading terminal is installed in the usual way. The copied file is placed in the folder “Indicators”. It can be found if you follow the path: MT4 – “Open data directory” – “MQL4”. Don’t forget to update the terminal, otherwise you won’t find Solar in the “Indicator list” tab.When it comes to configuration, it only works with one parameter – it’s a period. It determines the effectiveness of the use of this techanalysis tool. Besides, its value can be different depending on the currency pair and timeframe.
Application in trading
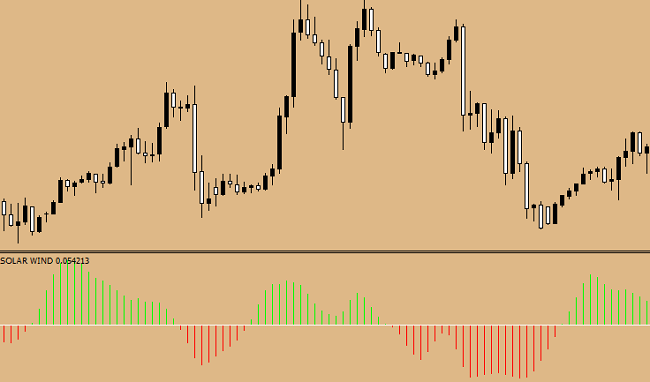
Before I tell you about it, let’s see how the Solar indicator looks on the chart:

The Solar indicator can be used to determine the direction
the trend. If the columns, colored green, are above zero
– an upward trend. If the columns colored red are zero
level – downward trend.The decision to open a trading position on small timeframes can be made at the moment when the indicator crossed the “0” level. If it happened from bottom to top, buy, top to bottom, sell. When trading on large TF, the optimal points for opening
Orders should be searched for with the help of additional indicators or candlestick analysis.This is another way of using this indicator for opening
Orders consist in using overbought/oversold zones. That’s what this is about.
you need to add the appropriate levels (80/20 or 70/30) to the settings. The decision to…
The purchase can be accepted if the red bars have entered the oversold zone, and
then came out of it. For sales – by analogy: green bars were in the zone
overbought and out of it.Well, the last variant of working with this indicator
tracking the divergence. If the price drops and the size of the red bars
decreases, it indicates a possible reversal of the price movement direction. If… if…
the price rises and the size of the green bars decreases, it also indicates
about a possible market reversal. Solar indicator is definitely noteworthy. But it must be tested in demo trading or on a small cent account. And only after that do we decide to trade on a real account.solar_windDownloadFyodorov’s Inga13.03.2019
