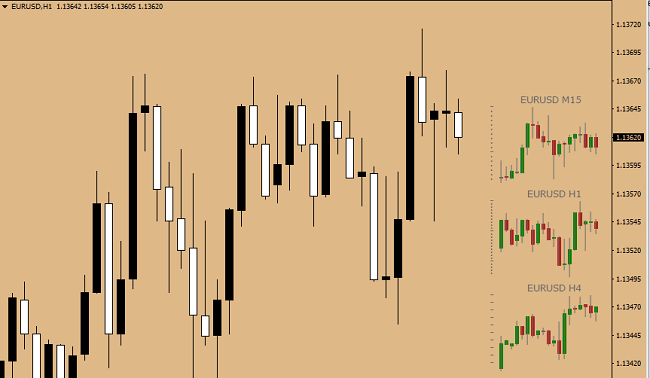
Trading strategies that traders use in their trading often involve monitoring the situation on different timeframes. To do this, you have to open several charts, which is not very convenient. In order to simplify this task, the MiniCharts indicator was developed. That’s what I’m gonna tell you today. The MT4 inicator has no special features for installation. We’re doing this the standard way. The chart of the traded instrument will show this picture:

The window of the selected timeframe shows additional mini graphs indicating the situation on other TFs. Which timeframes should appear in the window in the settings.
MiniCharts indicator setting
It must be said that the parameters in the settings
a lot, but they’re easy to understand. I’m only gonna stop at the very
important.Corner – with the help of numbers 1,2,3 and 4
you can specify in which area of the window we want to see mini graphics.CandleMode – choose in which form
mini graphics should be displayed: candlesticks or bars.BarsToDisplay – this parameter allows
specify how many candlesticks (bars) should be in the mini window.Width and height of the mini window can
Define with the help of the Width/Height. parameterWickColor and BullBarColor/BearBarColor parameters
are designed to select the color of shadows and candlestick bodies. The other parameters of the indicator also concern the design of windows with mini charts.
How the MiniCharts indicator can be used in trading
The main purpose of this
The analysis tool is to monitor the situation at a higher level of the
timeframe for making an optimal trading decision. Suppose a trader
trading on an hourly schedule. At the same time, he sees that the price on the daily chart
after the correction has resumed upward movement. Which means it’s time to look
the entry point for the purchase. If such a signal appears, you can open a buy. orderBut that’s not all. The indicator in question today can also be used to track the correlation between two currency pairs. But to do this, you need to make the appropriate settings. A correlation asset must have the same timeframe as the chart on which the trade is conducted.Practical use of the MiniCharts indicator can be evaluated only if you try it yourself in trading. First of all, you have to do it on a demo account. And after getting positive results, you can use the indicator in real trading to increase its efficiency.MiniChart_v12DownloadFyodorov’s Inga27.02.2019
