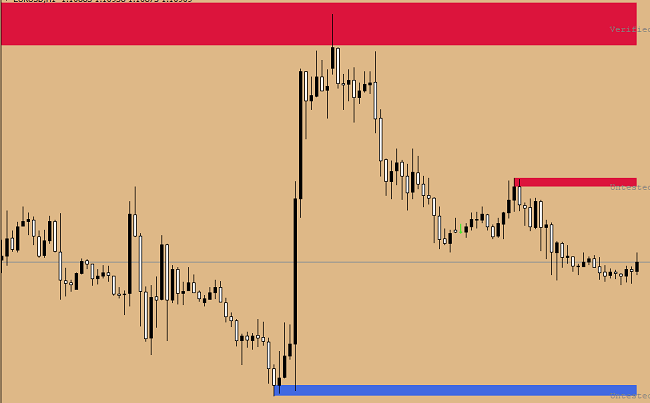
Opening of trade deals, focusing on important levels, has a high probability of making a profit. The levels have always been and will always be one of the most effective methods of analyzing the market situation. And today I want to offer you a indicator FXR SR Zones, which will define them for you and do this work qualitatively. In addition, it does not just draw levels on the chart, but also support and resistance zones, which makes trading even more convenient and efficient. The indicator also comments on each level. To do this, he writes the corresponding word next to each zone.Weak – the level is weak, i.e. the price has made only one
an attempt to punch it through.Untested – the level to which the price has approached, but not
tested it.Verified – the price tried to overcome the level twice, but it
it didn’t work out. Proven – the price has tested the level several times (more than
two), but unsuccessfully.Turncoat is what we call a reversal level. The price punched it and then turned around and went backwards.
FXR SR Zones settings
Parameters in the settings are quite a few, but they all concern
line display. With their help you can choose the most convenient
settings. I’ll tell you about some of them. The Factor parameter can be used to set the line width.Time-Frame is used to select the required timeframe.If you’re not interested in weak levels, you can “turn them off
using the Zone-Show-Weak. parameterComments to the levels I have told you about above,
are activated using the Zone-Show-Info. parameterThe other parameters allow you to set up alerts about the formation of levels.
How to use the FXR SR Zones indicator in your trade
In the chart we’ll see about this picture:

The standard rules for working with levels are used for opening deals. Trading orders are opened either for a break-down or for a break-down from the level. For those who are still unfamiliar with the subject, I’ll explain. If we see that the price broke through an important resistance level, we can make a decision on a buy deal. If it could not overcome it and after testing it bounced back, you can open a sell order. The same thing happens when working with the support level, but with the corresponding corrections.Try to test the FXR SR Zones indicator in demo trading. Once you have gained a positive experience, you can apply it in real money trading. Trading results can be improved by using an additional analysis tool.FXR SR ZonesDownloadFyodorov’s Inga28.08.2019
