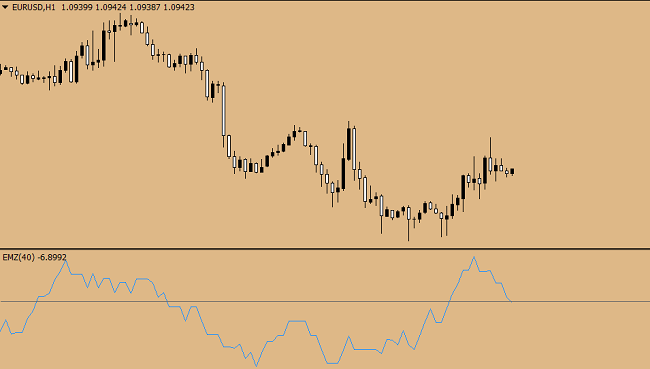
Ease of Movement indicator refers to proven and reliable analysis tools. I therefore recommend that you pay attention to it. Its author is quite a well-known trader in the markets Richard Arms. The work of the indicator is based on the analysis of volumes. It differs from other instruments of this kind in that it demonstrates high accuracy of signals. Besides, the EOM is a self-sufficient indicator. Which means you can only trade on his testimony. However, an additional signal filter will never hurt. As for the settings, there are only three parameters: the period, as well as the maximum and minimum volumes to be taken into account in the calculations.
Ease of Movement
In the chart the indicator is a curve that changes its position relative to the zero level.

Ease of Movement indicator analyzes the correlation between price and volume. To be more specific, the price is calculated according to the following formula: (max current day + min current day)/2 minus (max previous day + min previous day
of the day)/2The value received corresponds to the volumes.
Trade opening signals
If the indicator line rises above 0, it is
indicates an upward trend. You can consider opening a buy order. Accordingly, and vice versa.
If the blue line is below zero, we have a market
a downward trend. You can open sell.This system works very well in combination with strong
levels. Let’s say there’s been a breakthrough at this level. But we know that he’s
could be a falsehood. Our indicator can be used to assess the breakdown.
For example, the price broke through the resistance level. The indicator line
is above zero. That means the price is likely to continue
upward movement. You can buy it. If the price broke through the support level and the line
indicator is below zero – you can sell. As well as that, it is possible to open additional buy deals up to
as long as the indicator is in the positive zone and sell deals, if the indicator
is in a negative zone. Ease of Movement indicator can be successfully used in option trading. The rules are very simple. The curve crossed level 0 from the bottom to the top – we are buying a call option. The curve crossed the level from top to bottom – buy a put option. Begin by learning how to work with this instrument of techanalysis in demo trading. And only then can we move on to real trading.Fyodorov’s Inga27.09.2019
